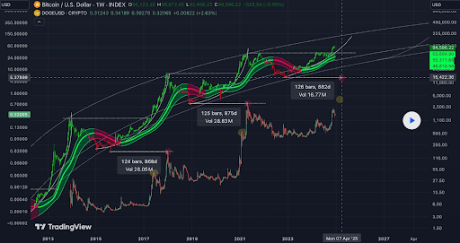
The cryptocurrency market has been running through a period of consolidation over the past seven days, with notable corrections observed in both Bitcoin and Dogecoin. Bitcoin, after hitting an all-time high of $108,135 on December 17, has seen a retracement towards $93,000. Similarly, Dogecoin has faced pressure, dipping from its recent highs near $0.48 to settle just above $0.30 at the time of writing.
According to technical analysis of both cryptocurrencies, an interesting correlation has emerged that points to Dogecoin surging to $5 in the next few months.
The 800-Day Trend: A Case For Dogecoin’s Correlation With Bitcoin
Bitcoin and Dogecoin have one of the biggest correlations among cryptocurrencies, particularly during market cycle transitions. Bitcoin has always led inflows and outflows into the crypto market, and Dogecoin has historically mirrored its price trends very closely.
Related Reading
As pointed out by a crypto analyst on social media platform X, these patterns often extend beyond immediate price movements. For example, the number of days between Bitcoin’s cyclical bottoms and Dogecoin’s subsequent peaks has shown a consistent rhythm.
Particularly, technical analysis shows that there’s been a consistent pattern of approximately 800 days between Bitcoin’s bottom and Dogecoin’s next major peak. The historical data supporting this theory is compelling. This first time this pattern showed up was in 2017, when the Dogecoin price peaked 868 days after Bitcoin’s bottom of the preceding bear phase in 2015. Again, the 2021 bull rally exhibited this same phenomenon, with Dogecoin peaking at its current all-time high of $0.7316 875 days after Bitcoin’s bottom in 2019.

What Lies Ahead For Dogecoin Price?
The ongoing market cycle appears to be following a similar trajectory. Bitcoin reached its most recent bottom at $15,422 during the first half of 2023, following a long bear market that saw significant declines across the crypto industry in 2022 and early 2023. Since then, Bitcoin has entered a new bullish phase, gaining momentum in the second half of 2023 and throughout 2024.
Related Reading
Keeping in mind the 800-day trend, Dogecoin’s next major peak could align with a timeline of approximately 800 days from Bitcoin’s 2023 bottom. This projection places Dogecoin’s potential peak around March or April 2024. In terms of price targets, the analysis provides an optimistic outlook for Dogecoin. Based on historical price performance and the scale of previous rallies, a price of $5 has been identified as a realistic target for Dogecoin around the projected timeline.
At the time of writing, Dogecoin is trading at $0.32, down by 1.8% in the past 24 hours. If this trend repeats itself, Dogecoin’s price could soar by 1,460 % from its current levels to new all-time highs. While this seems ultra bullish, it pales in comparison to other predictions of Dogecoin price peaks. Several analysts have speculated that Dogecoin could hit as high as $20 in 2025.
Featured image created with Dall.E, chart from Tradingview.com


